Business Operations & Performance Dashboard
Turned scattered sales and performance data into focused dashboards that make trends, targets, and next actions easier to see.
Visibility managers can actually use.
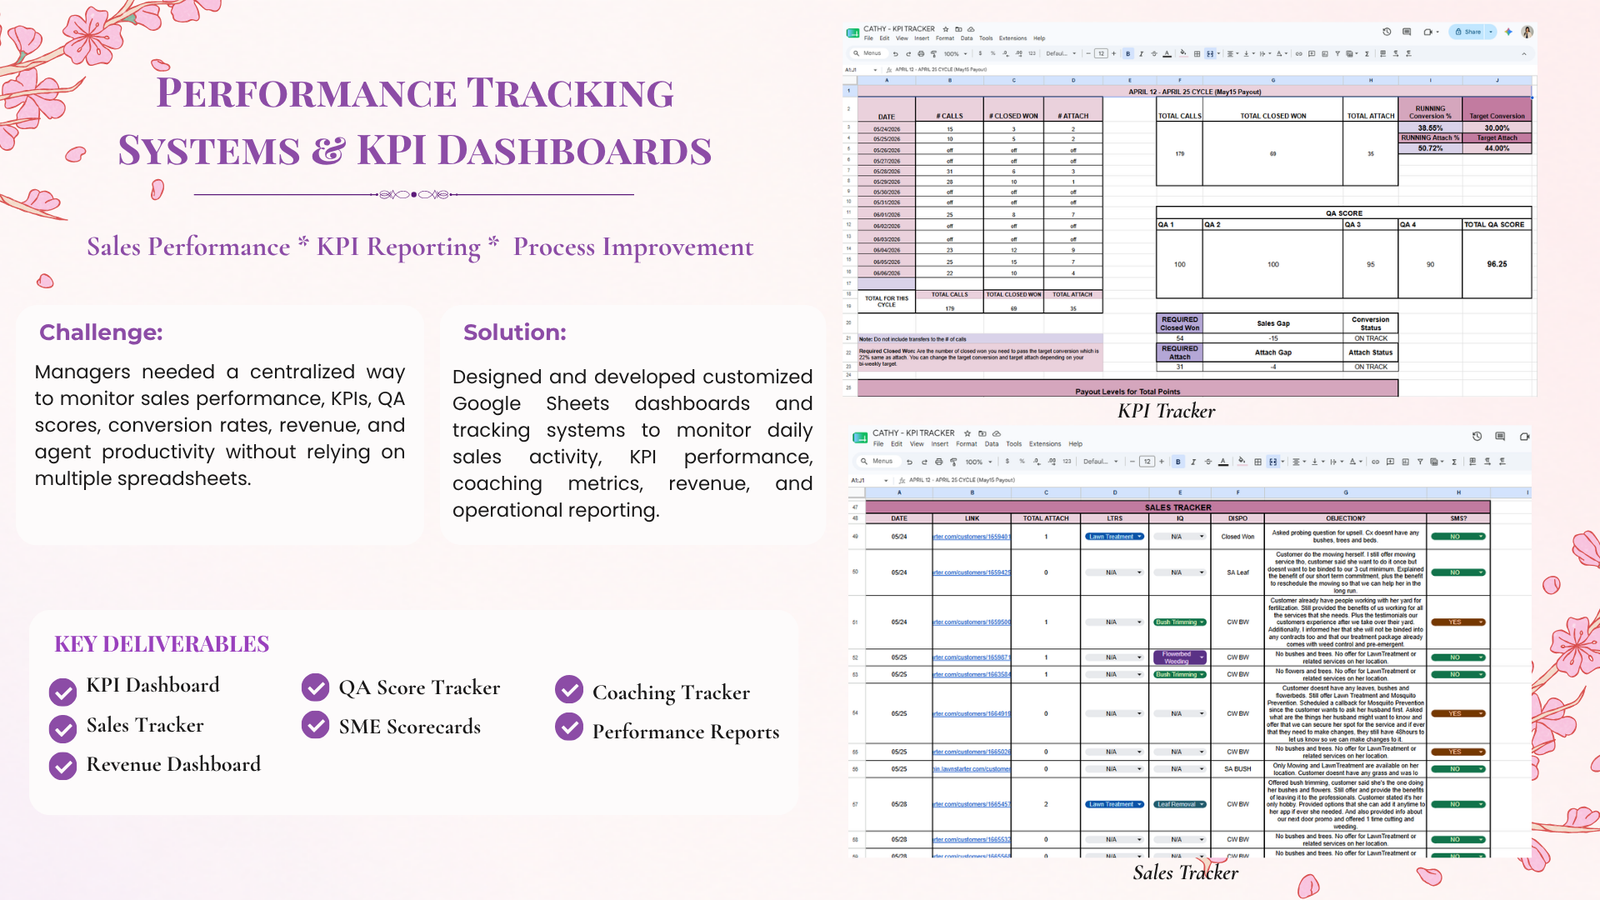
Sales, QA, revenue, coaching, conversion, and productivity data can quickly become fragmented across multiple files. The goal was to create a centralized reporting view without losing the details leaders need.
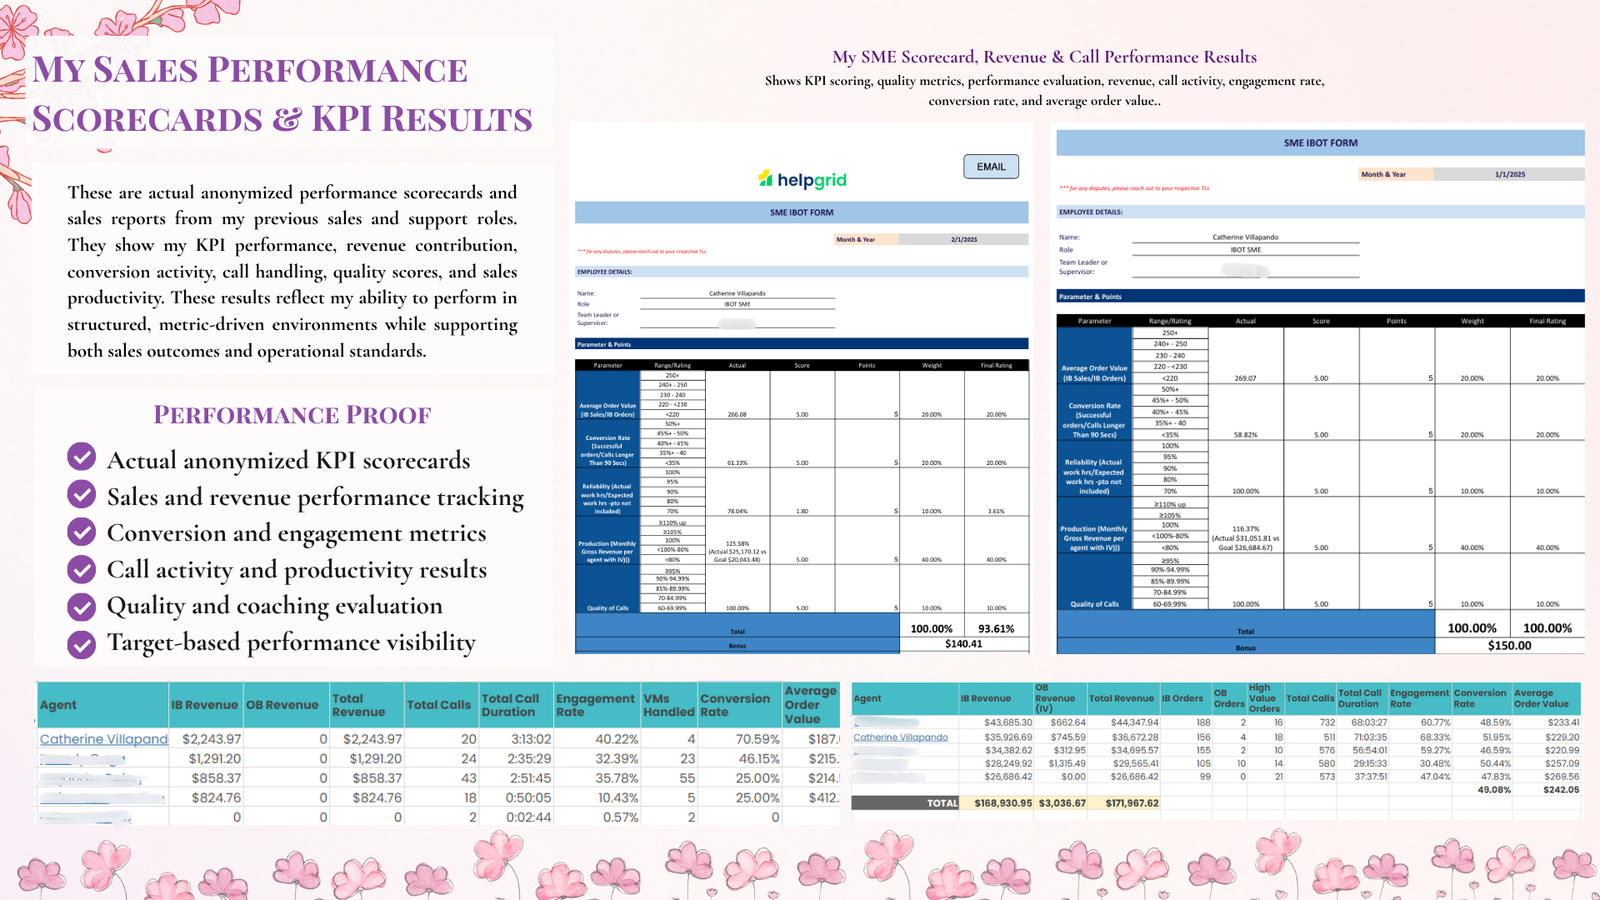
I designed customized Google Sheets dashboards and tracking systems to monitor daily sales activity, KPI performance, coaching metrics, revenue, and operational reporting. The proof section includes anonymized KPI scorecards, sales and revenue tracking, conversion and appointment metrics, call activity, productivity results, quality evaluation, coaching insights, and target-based performance visibility.
The work, in detail.
Browse the original case-study visuals prepared for this project, presented at full width for close review.